There are other problems with the PhysLogger software that I will be continually providing feedback on
Another data set from a stable thermally placed thermocouple.
There are other problems with the PhysLogger software that I will be continually providing feedback on
Another data set from a stable thermally placed thermocouple.
What are the sampling rates and thermocouple gain range in these?
How do I reproduce these?
Sampling rate = 100 Hz
-20 to 200 deg. C range (middle one)
Btw hitting the bitmap screenshot icon crashes the software, in all kinds of liveplot sessions.
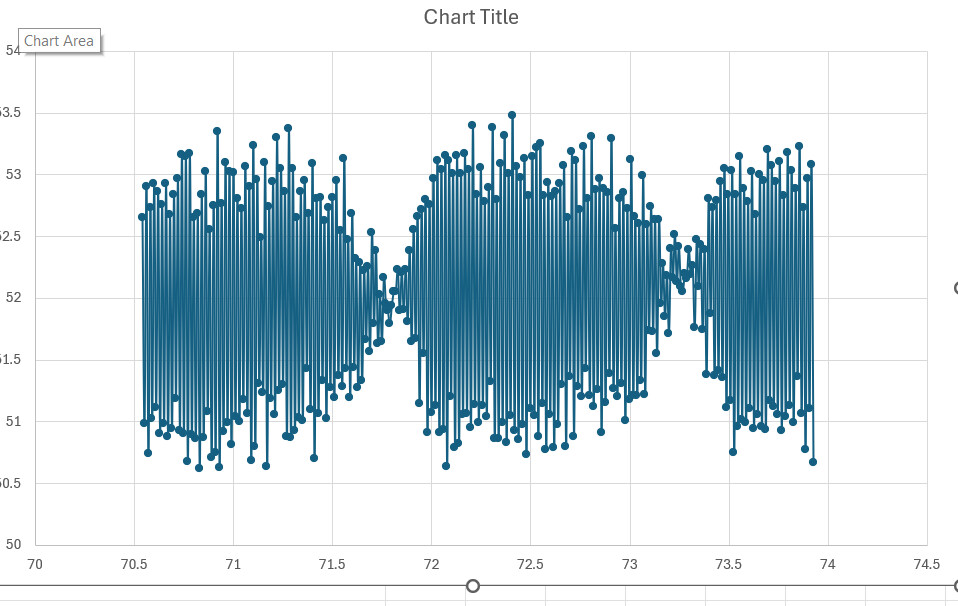
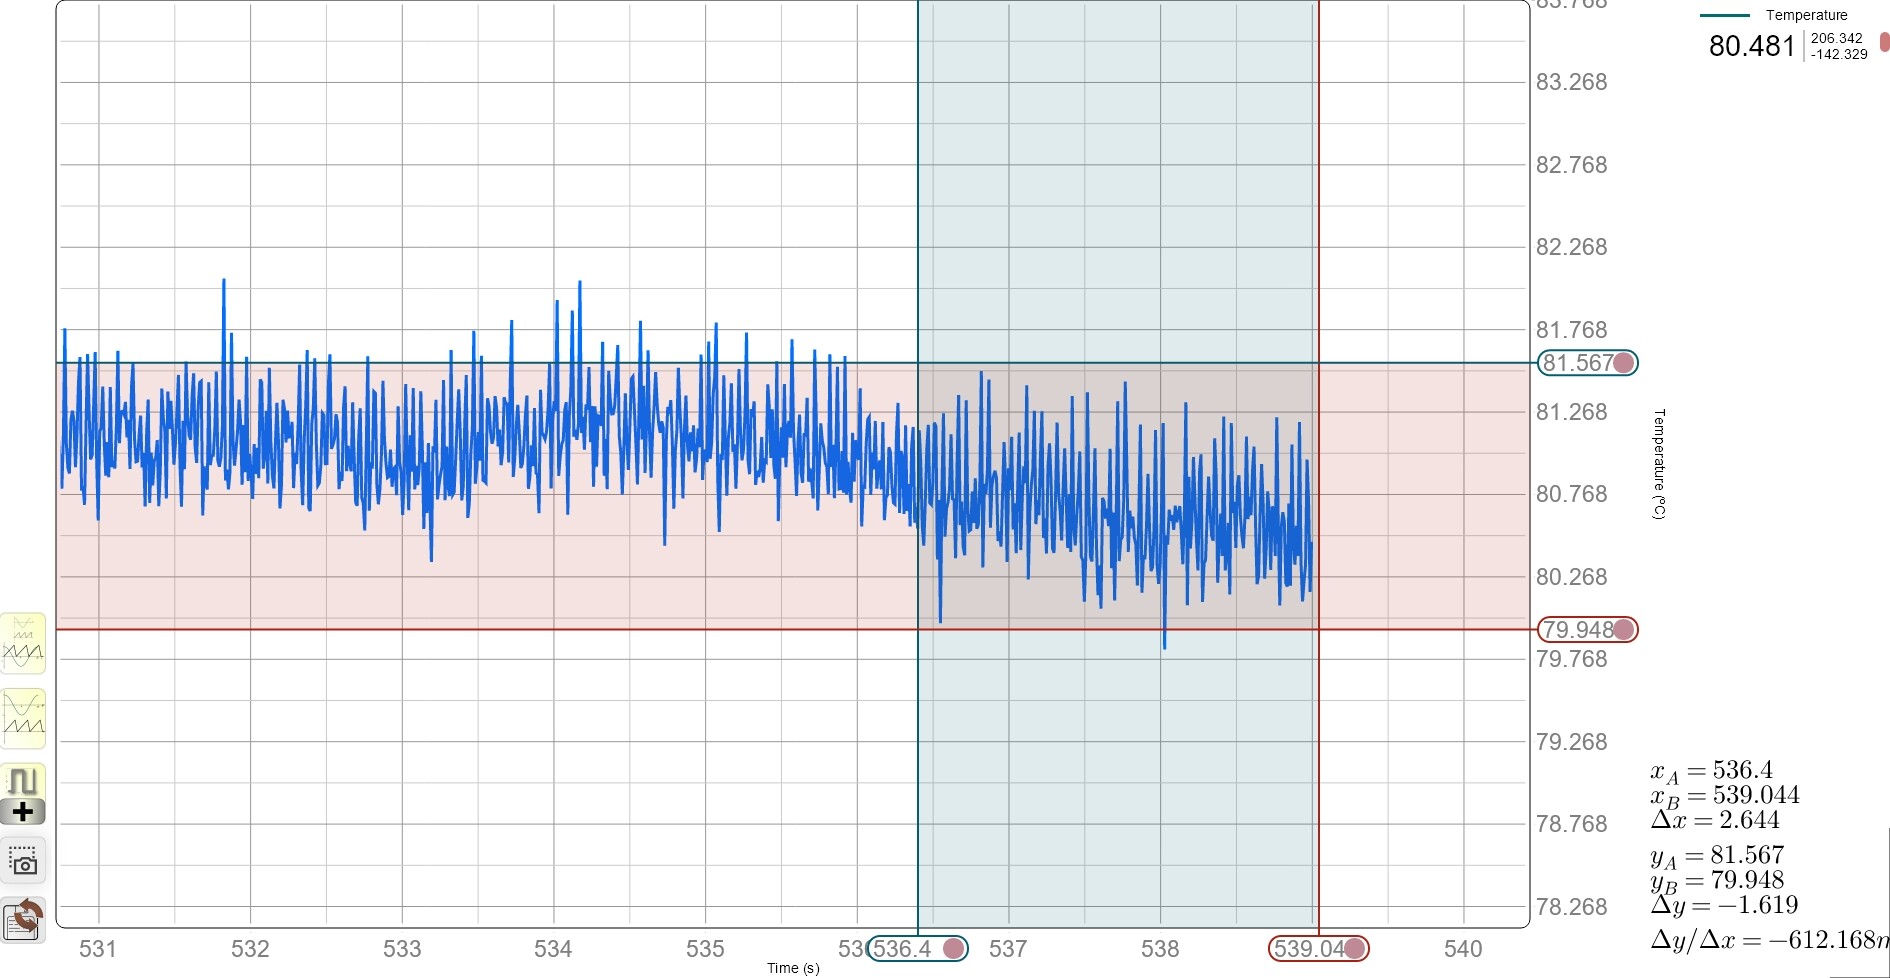
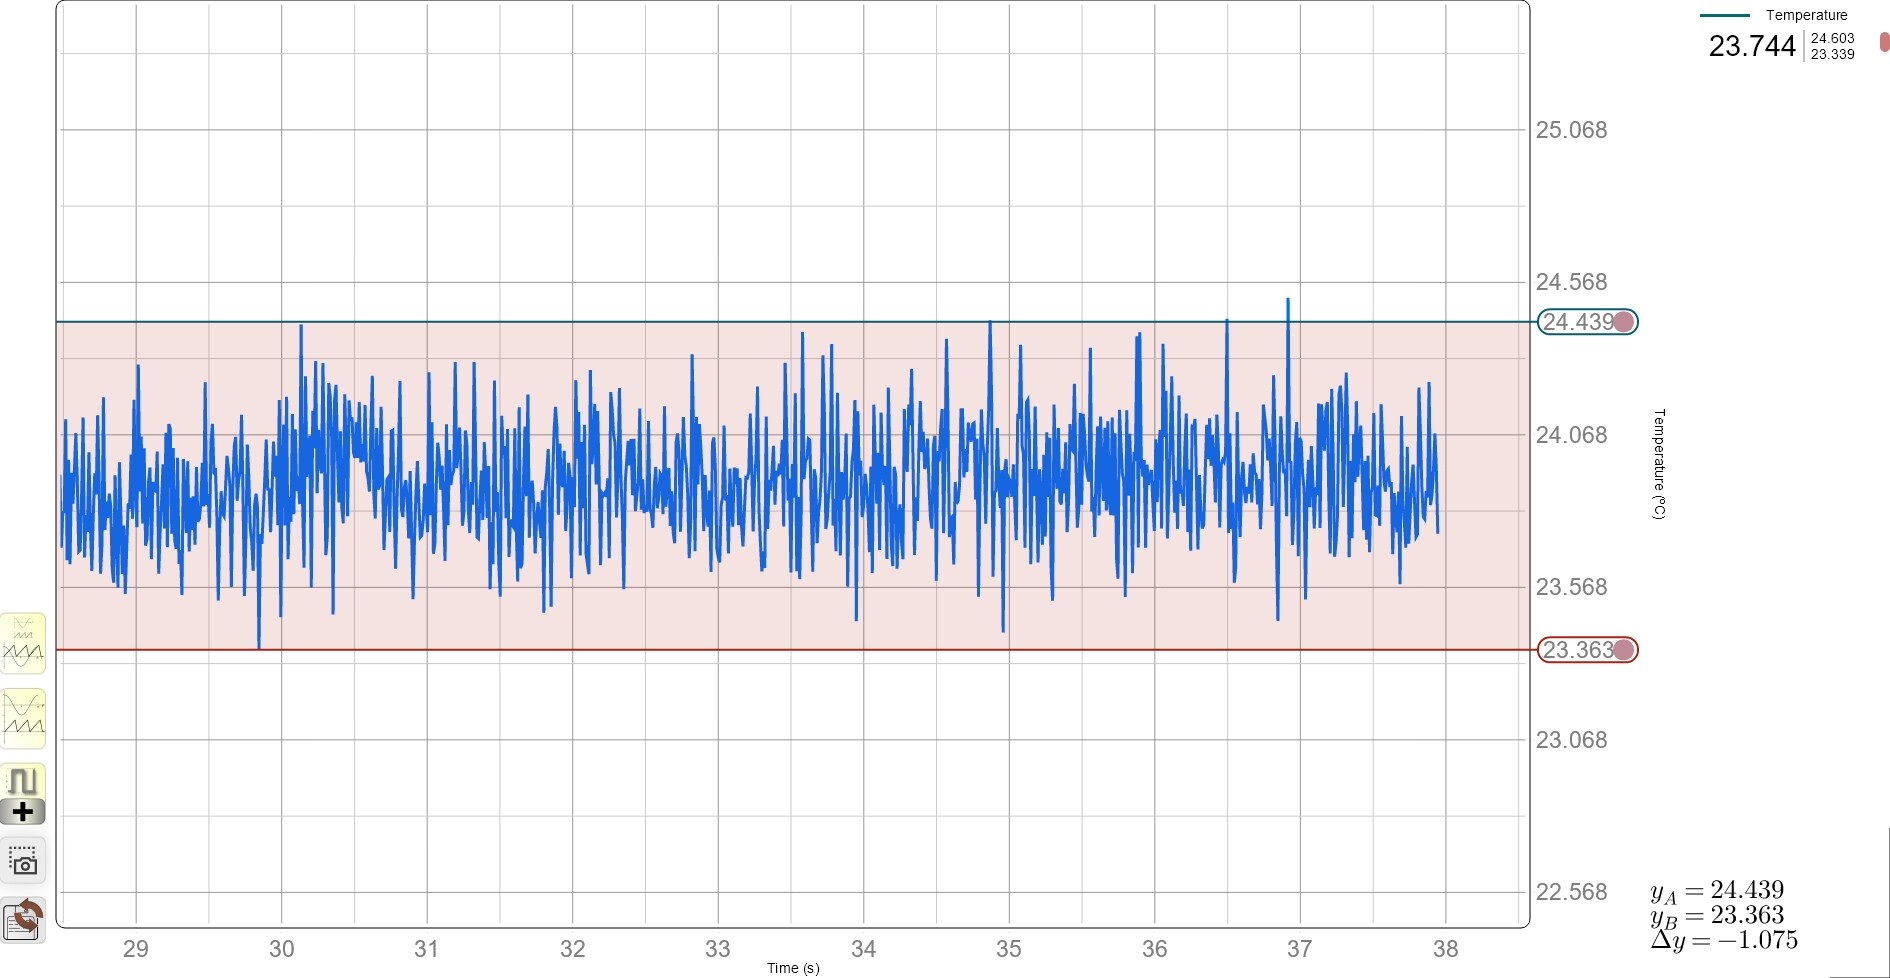
The total fluctuation in the 2nd dataset appears to be in a ±1.5 degree range. At 100hz, we shouldn’t expect it better than this. If we need higher accuracy, we need to reduce the sampling rate.
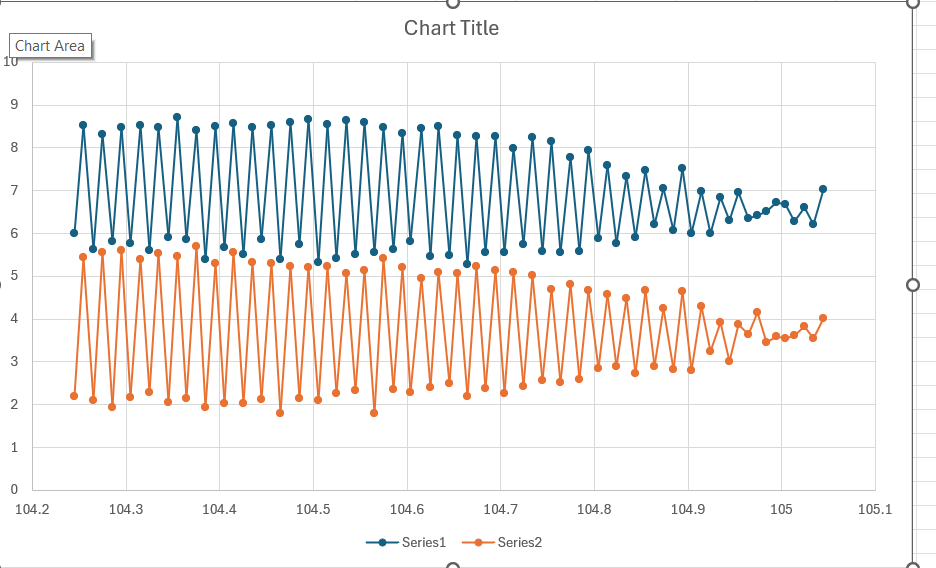
The fluctuation in the noise appears like beats (around 1hz frequency). I highly doubt that these are coming from the thermal characteristics. Looks like something originating as a result of interference (beats) from 50hz AC supply, the thermocouple acting as an Antena, and/or the thermocouple amplifier. Similar to what we see in the case of floating inputs; are we sure that all the analog connectors in the input circuit are tightly plugged in?
About the screenshot, could you try Win+PrintScreen as a backup? I can reproduce the crash here as well, it has come with the latest update when we needed to run PhysLogger on Mac. The update messed up the backward compatibility of screenshots. I have fixed it and will release it in the next update.
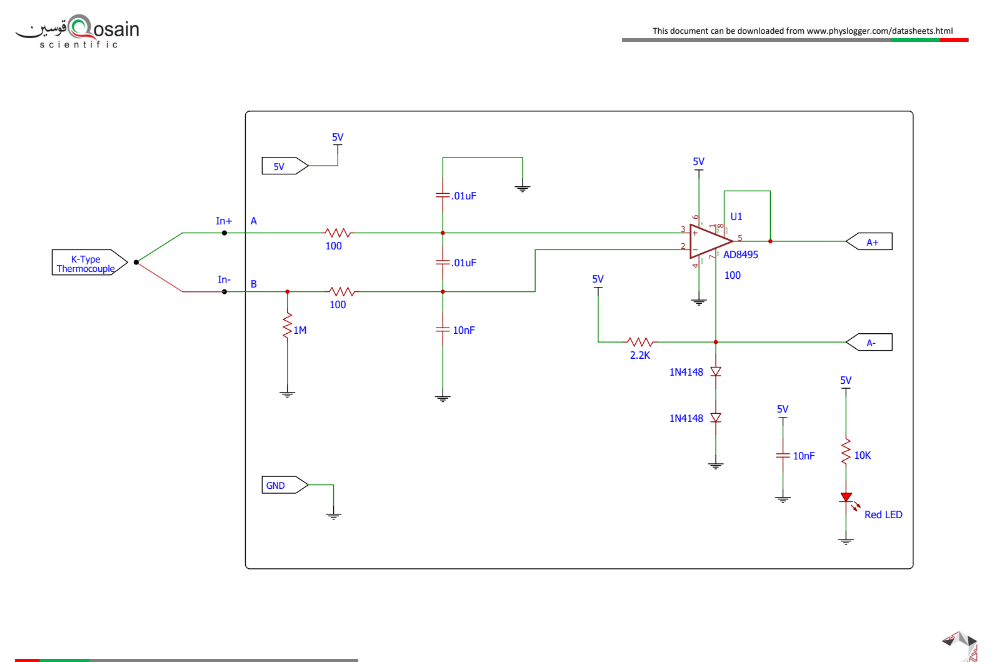
I know these large fluctuations are within the noise limit (coming from PhysLogger), but they are clearly a result of some avoidable artifact and they should be counteracted.The amplifier AD8495 has a resolution of 5 mV / deg C, clearly indicating low noise. We need to get the best value out of this amplifier. We need to probe more.
I also doubt these big fluctuations are due to the antenna effect.
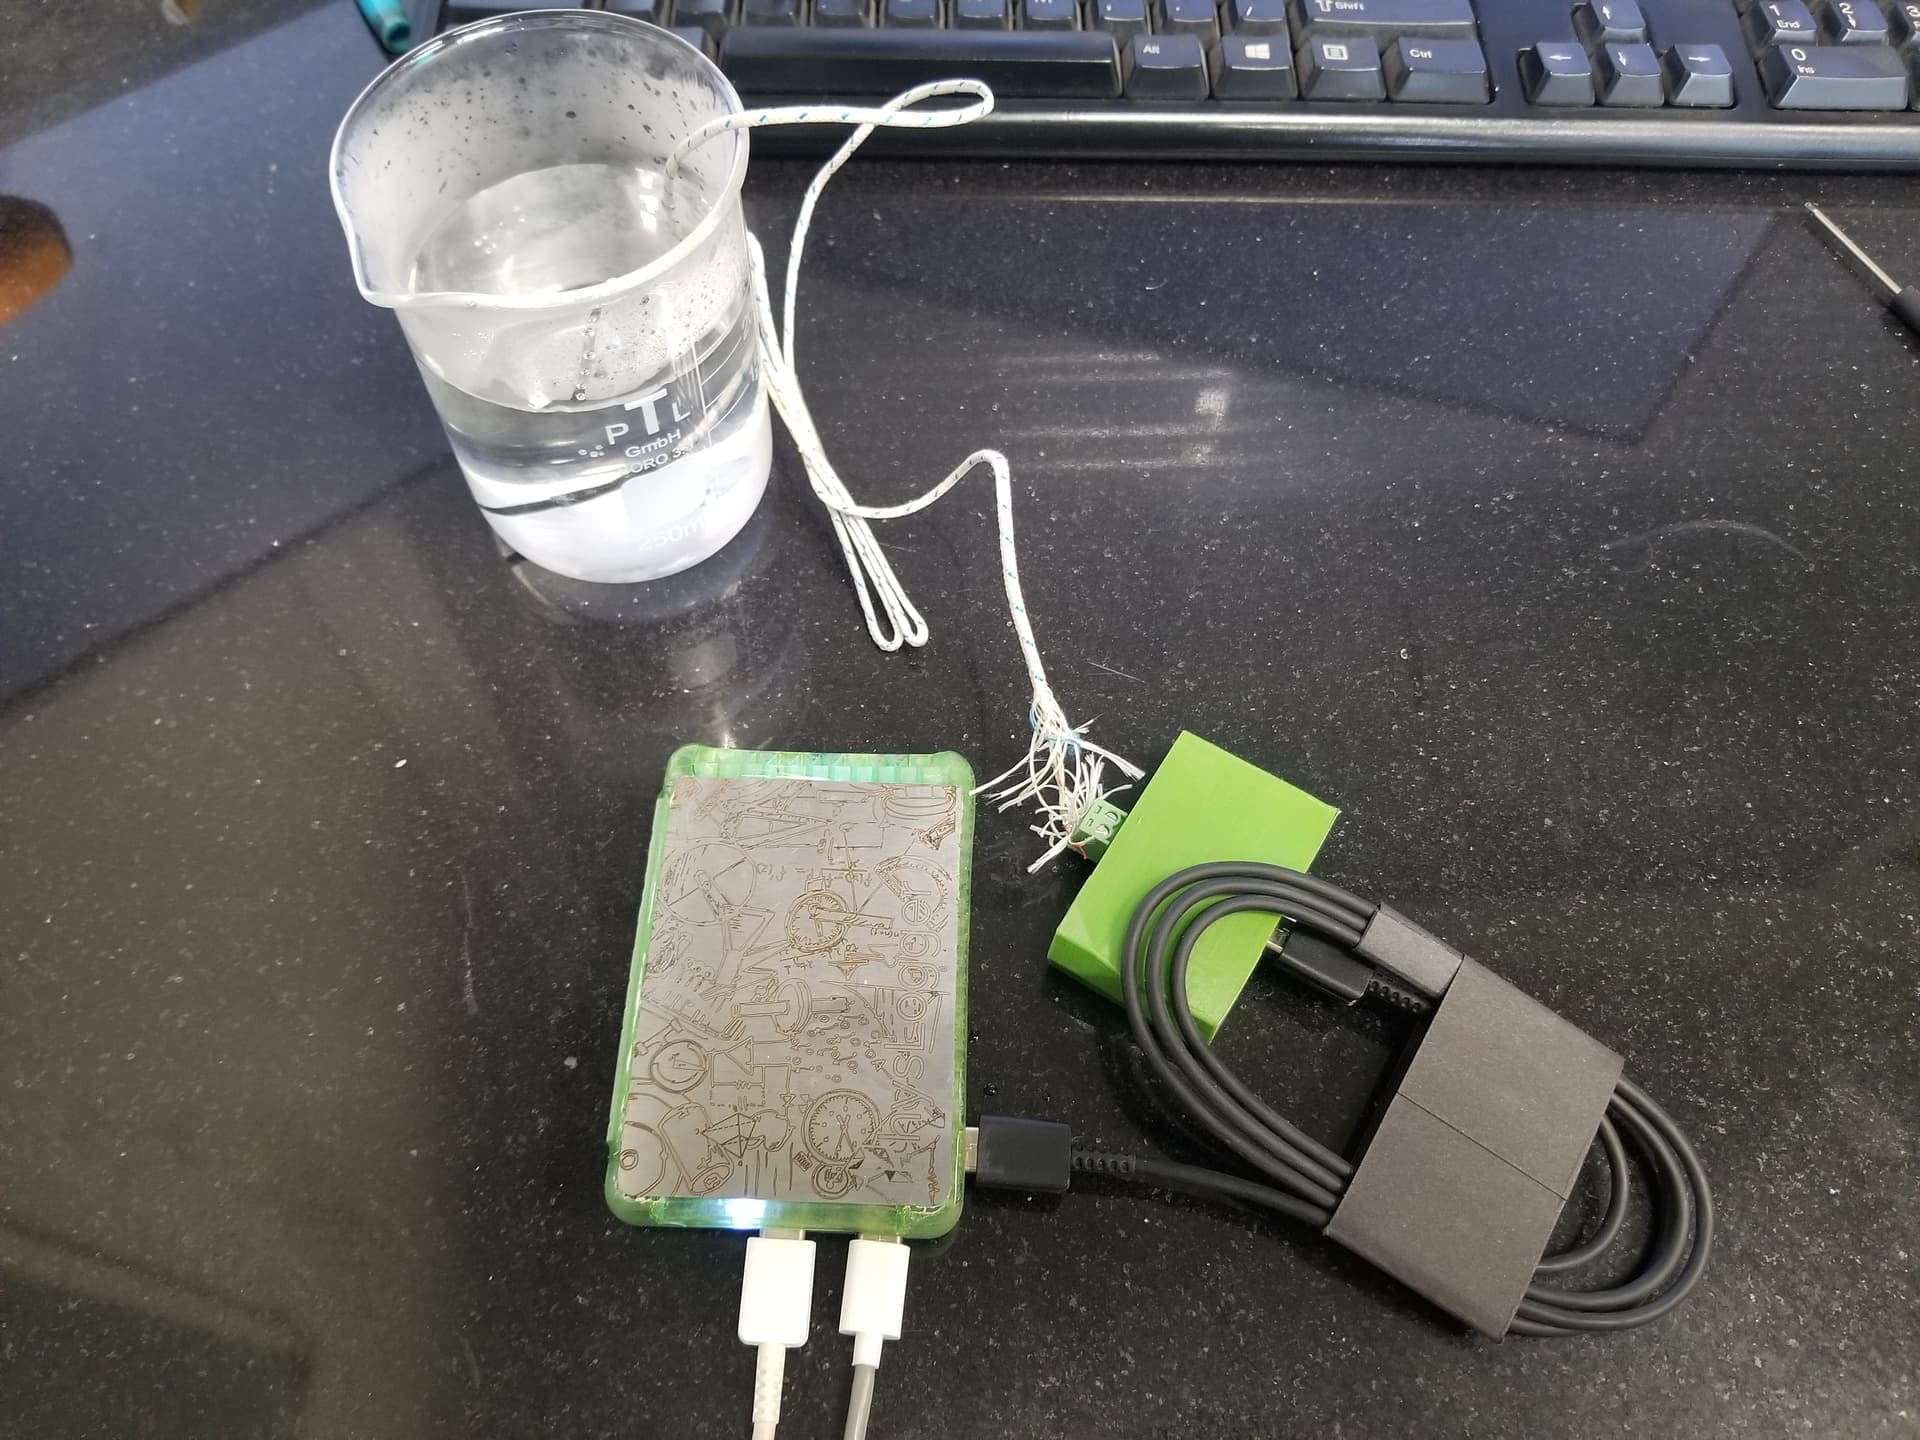
Can you kindly remove the PhysLogger and see the oscilloscope view on pin 5 of the amplifier here, please send me the data from the oscilloscope as you cool a glass of hot water. Furthermore, 100 S/s should be an ok sampling rate.
Also try 93 Hz (non-multiple of 50).
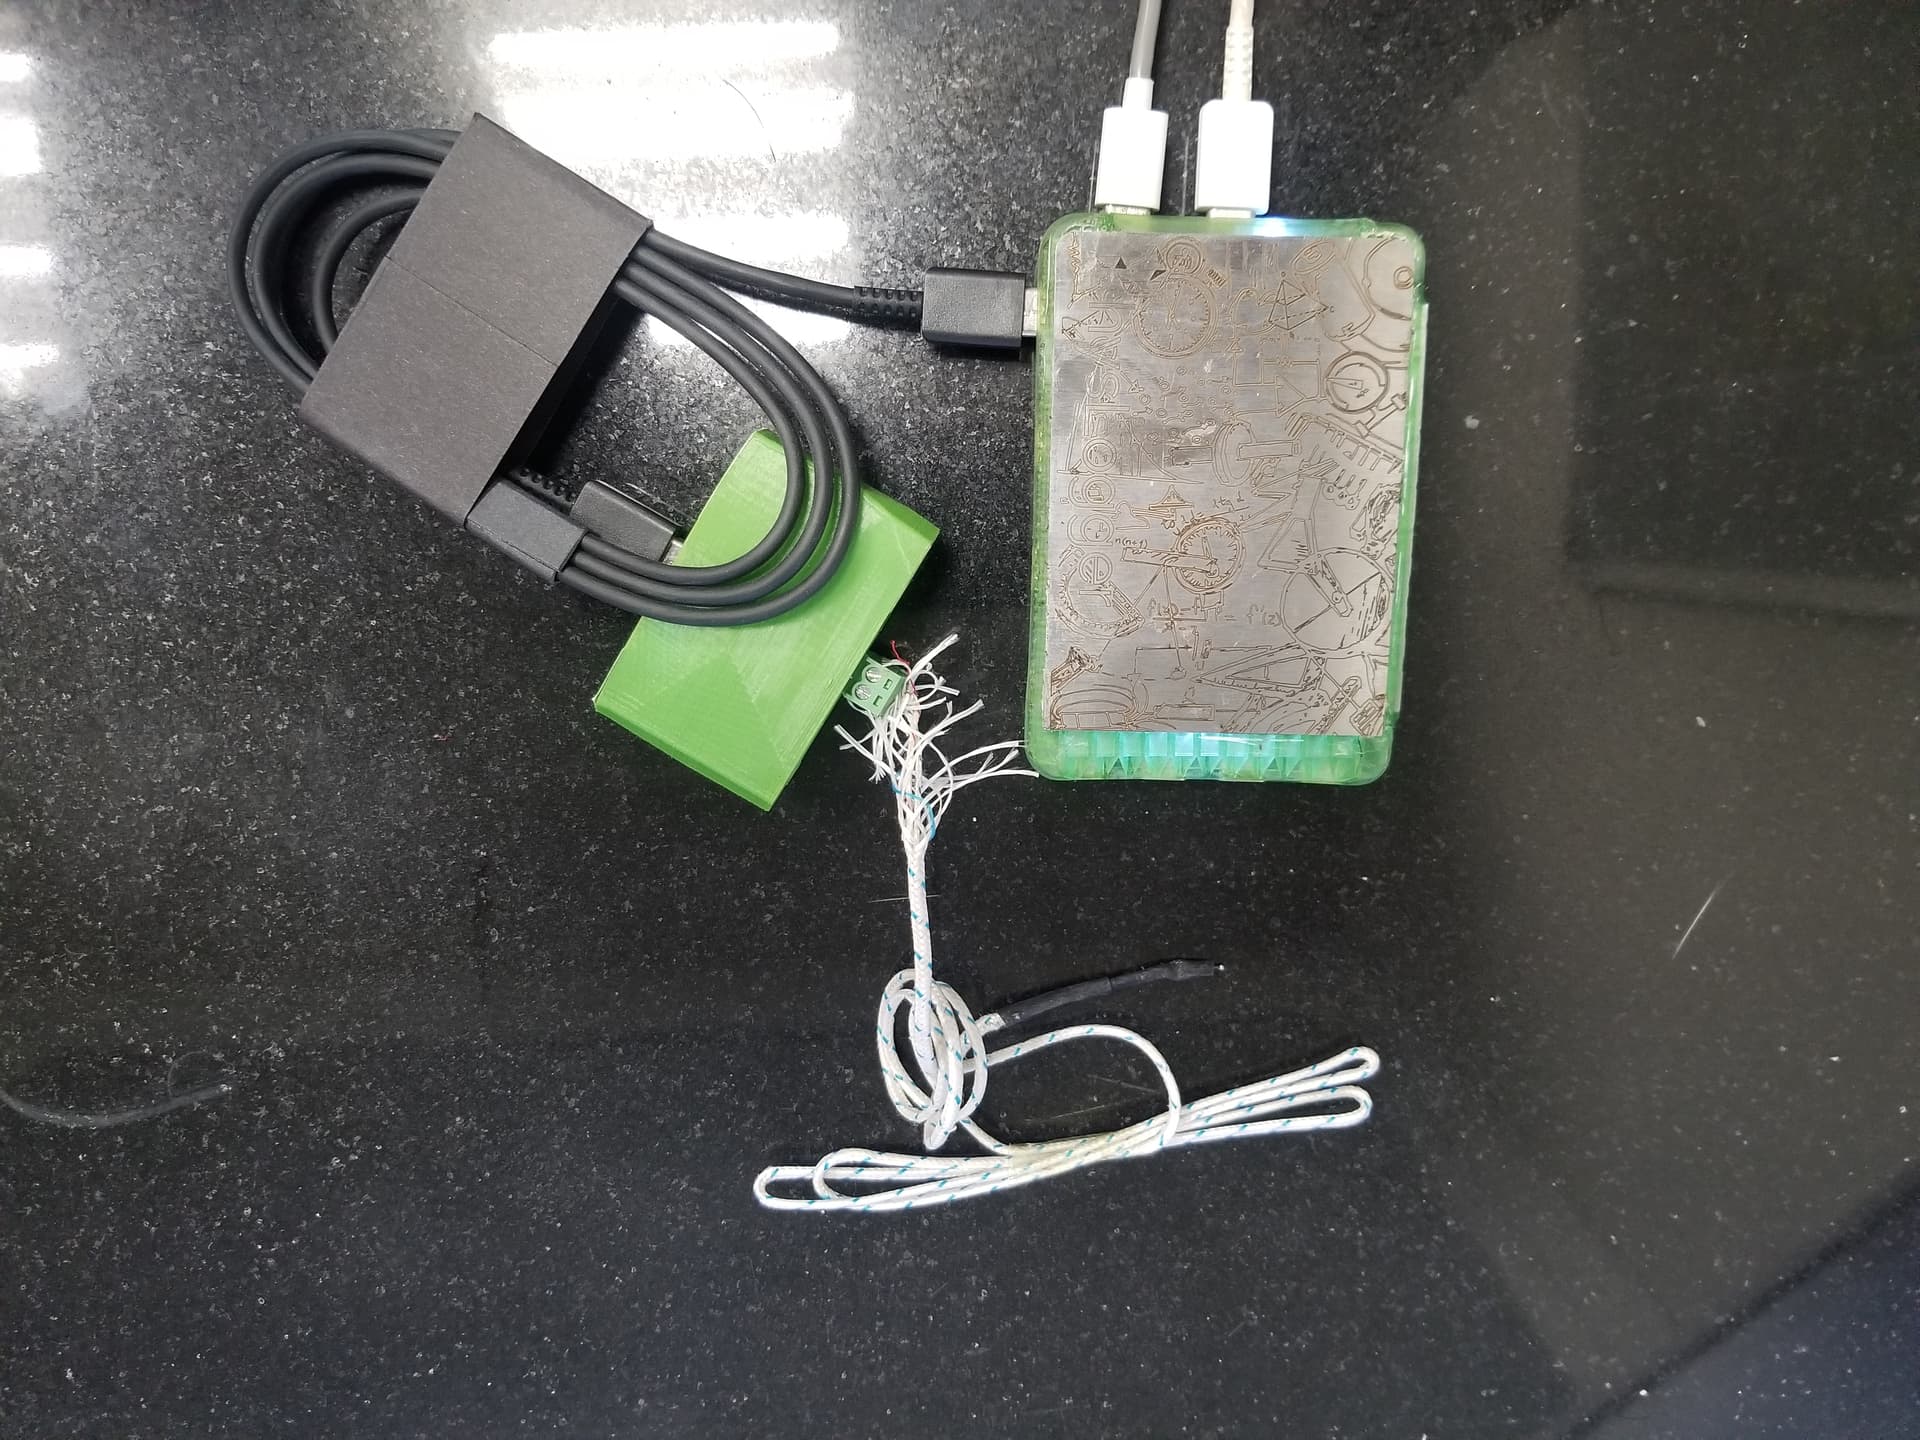
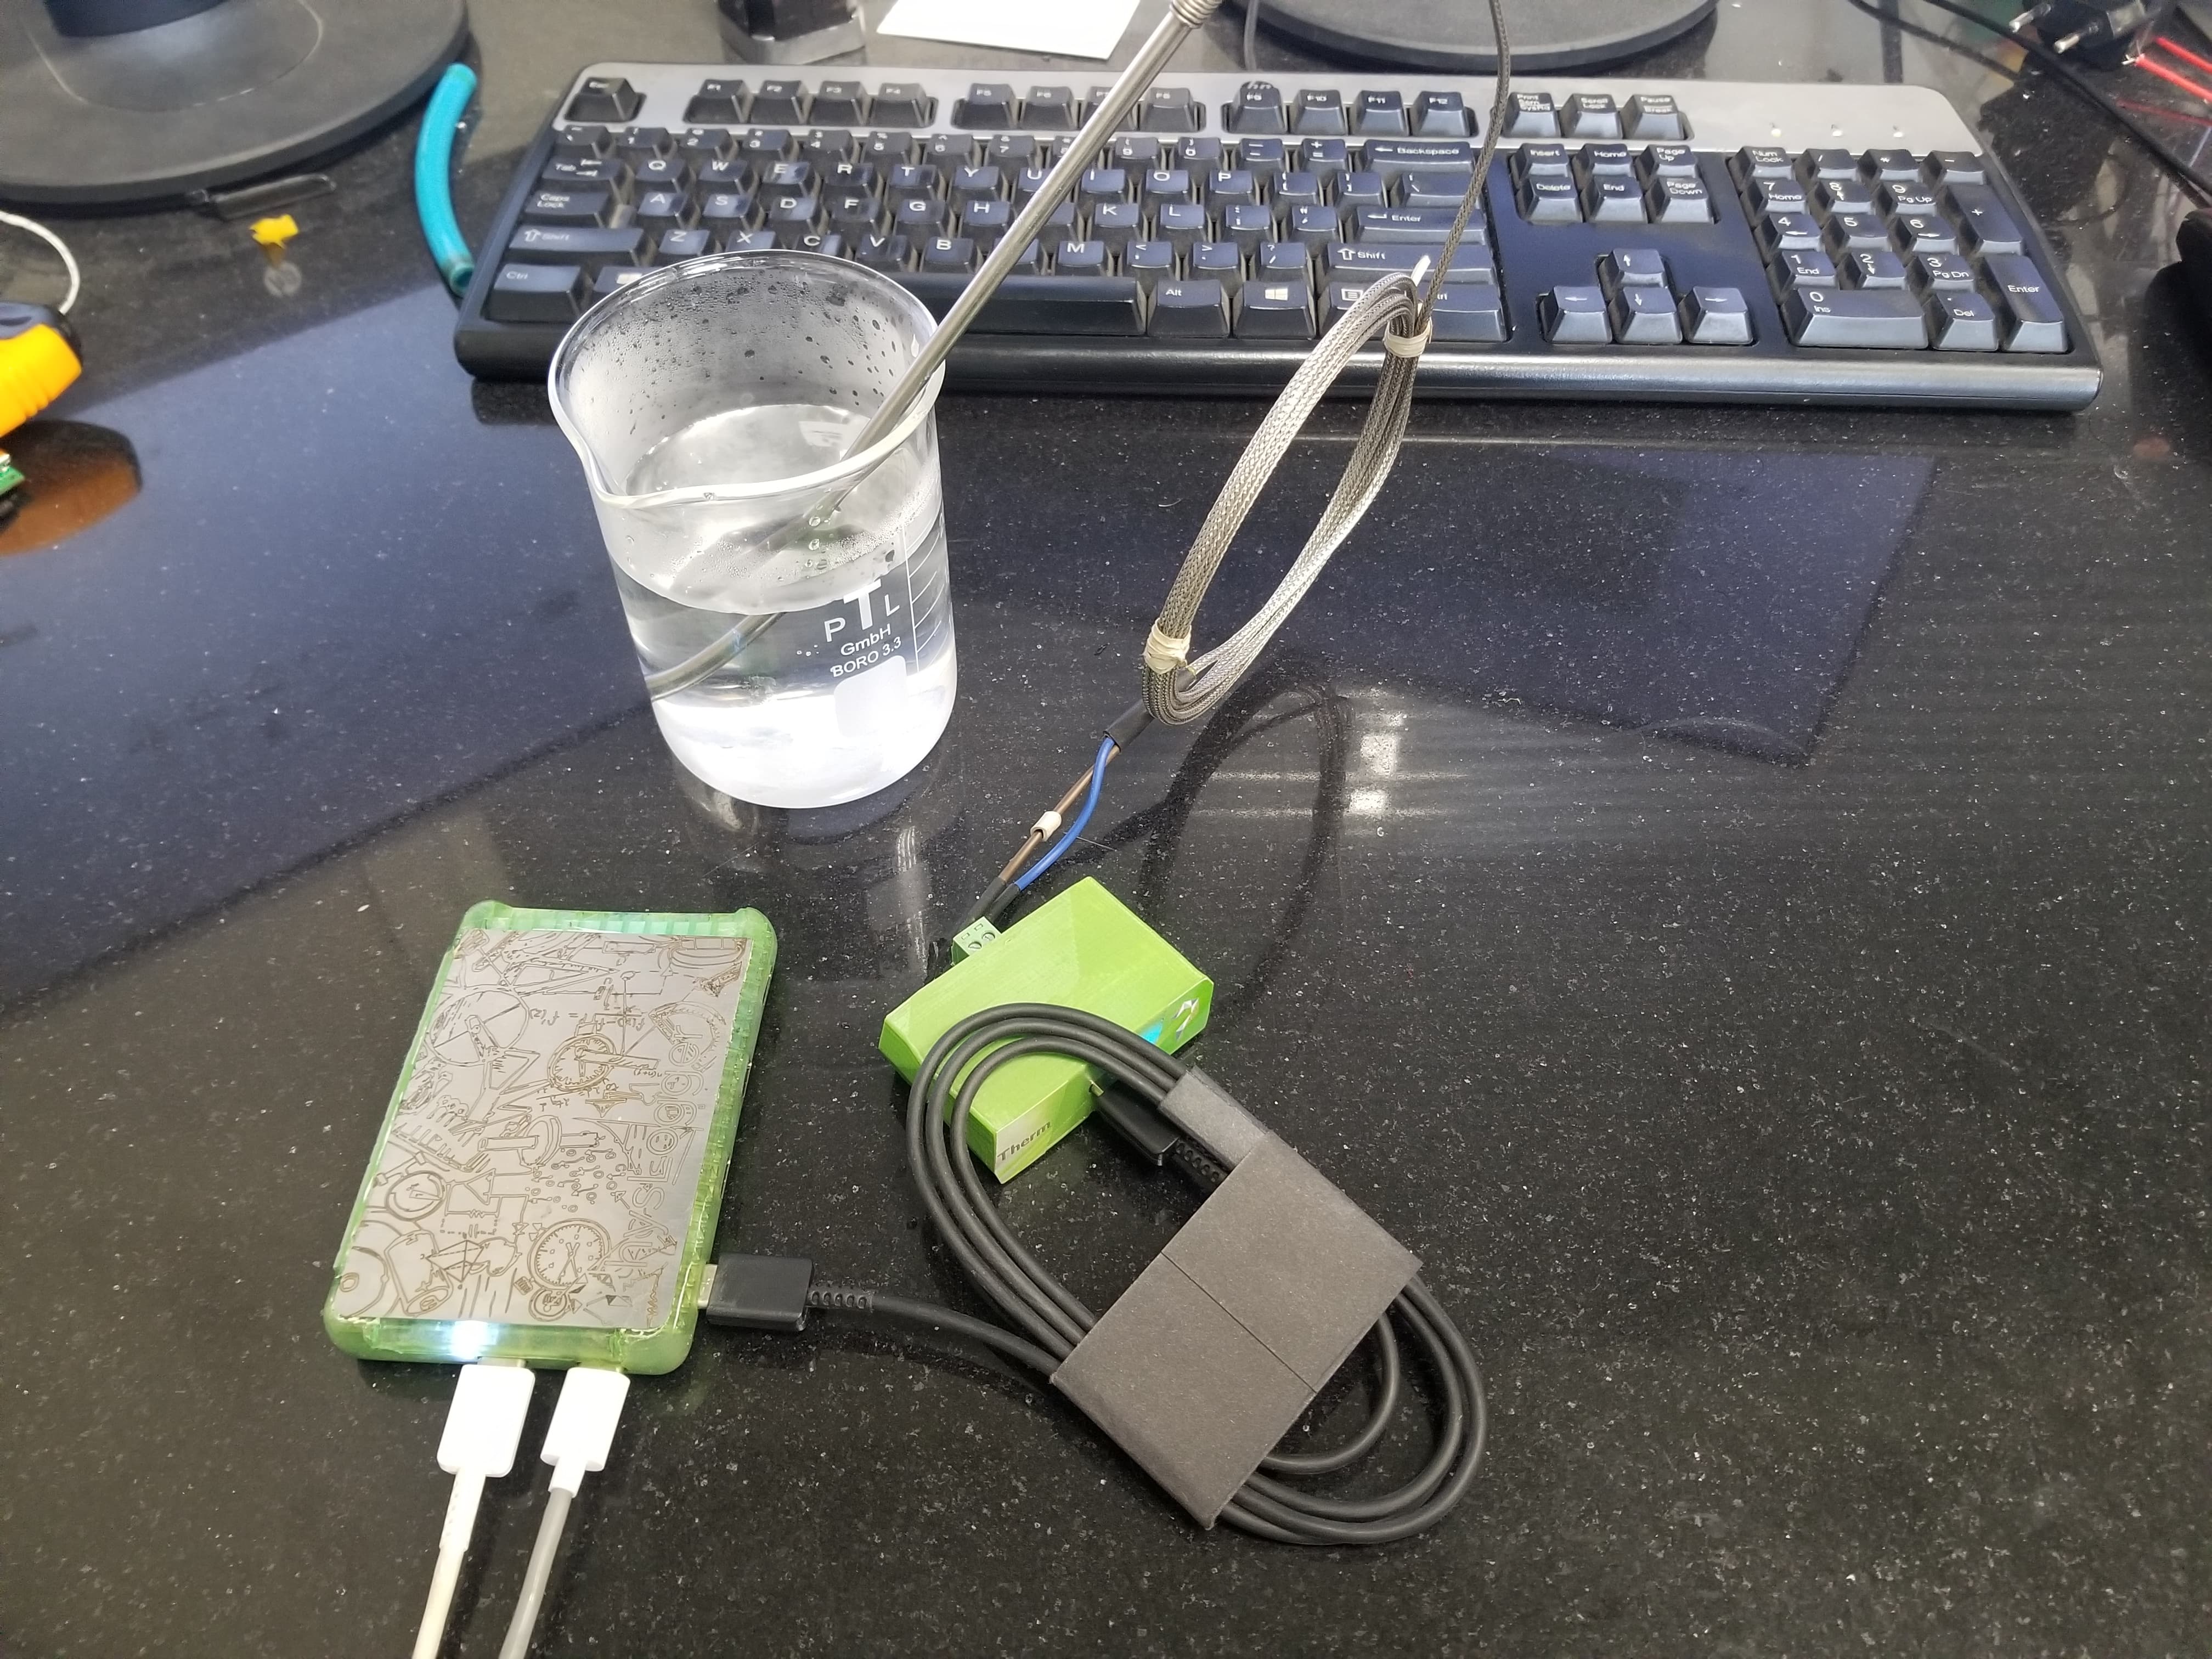
I’m still unable to reproduce the artifact. Can I see your setup?
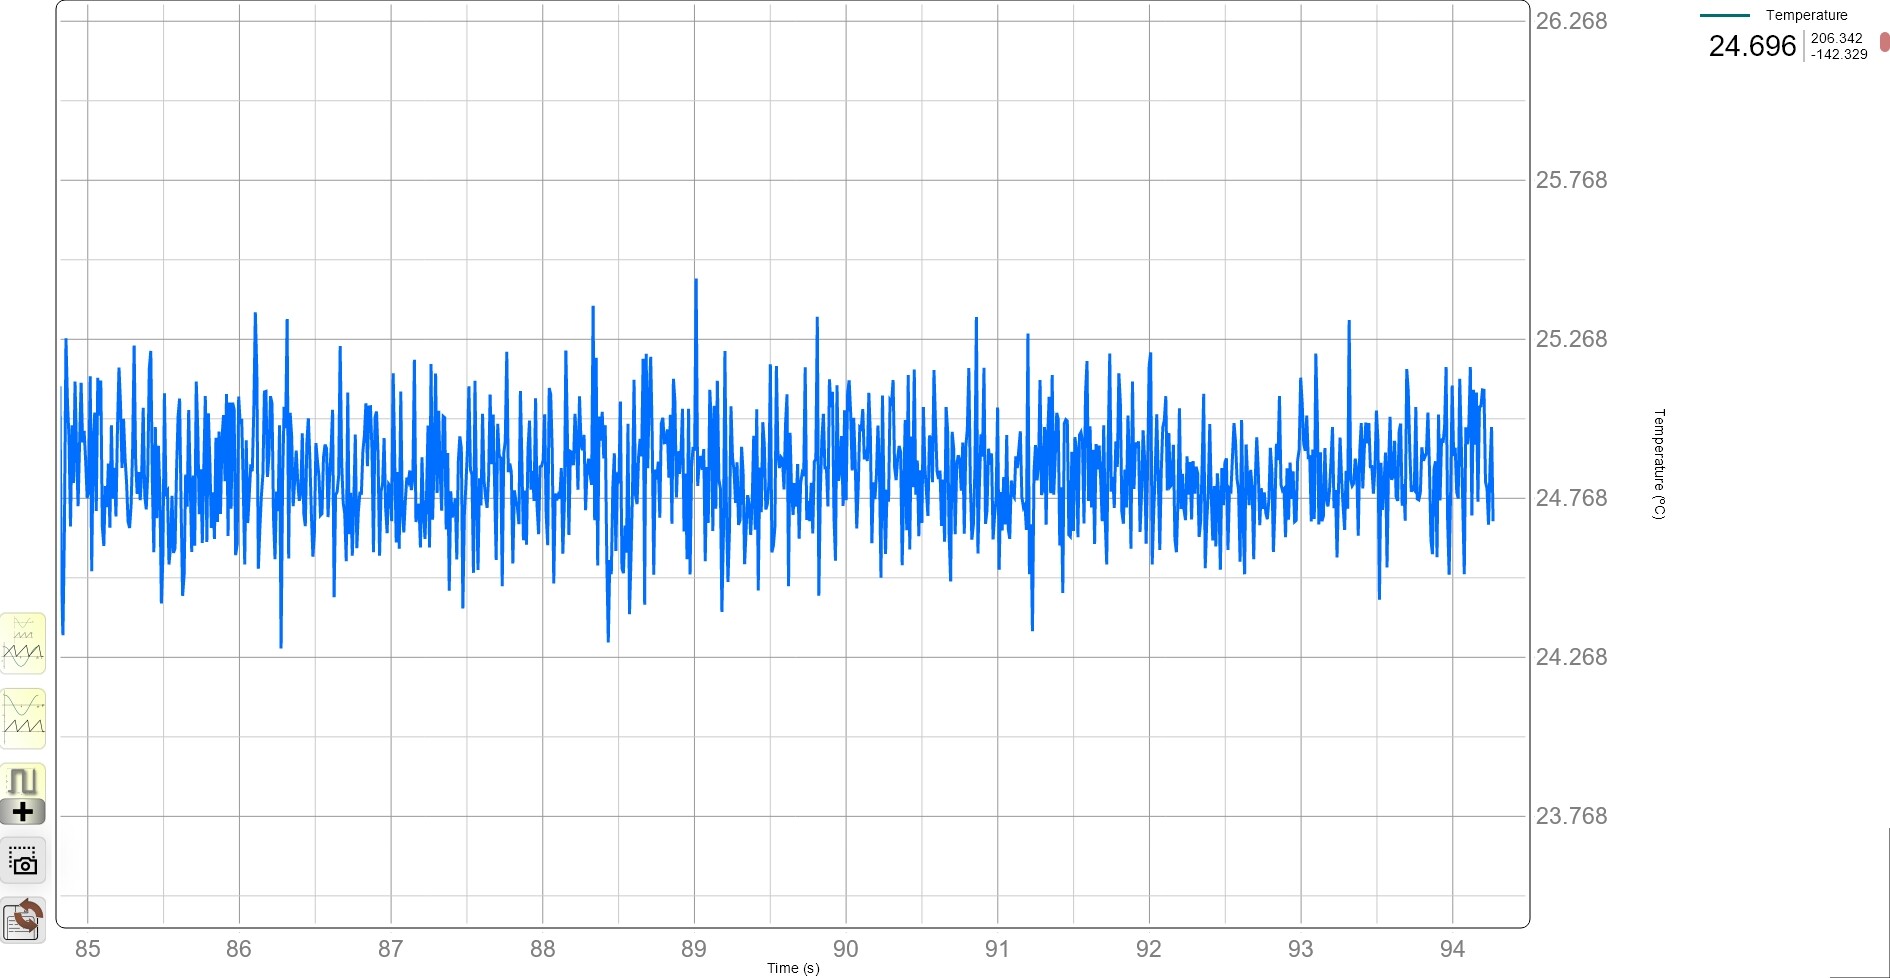
I did 4 experiments at 100hz sampling rate, -260-200 degrees (Celsius) range (yes, the middle one). If you want to reproduce similar screenshots, make sure display averaging is off. It is indicated by a yellow warning icon on the time axis. Click on the icon to scale out for no averaging.
Observations common in all the experiments:
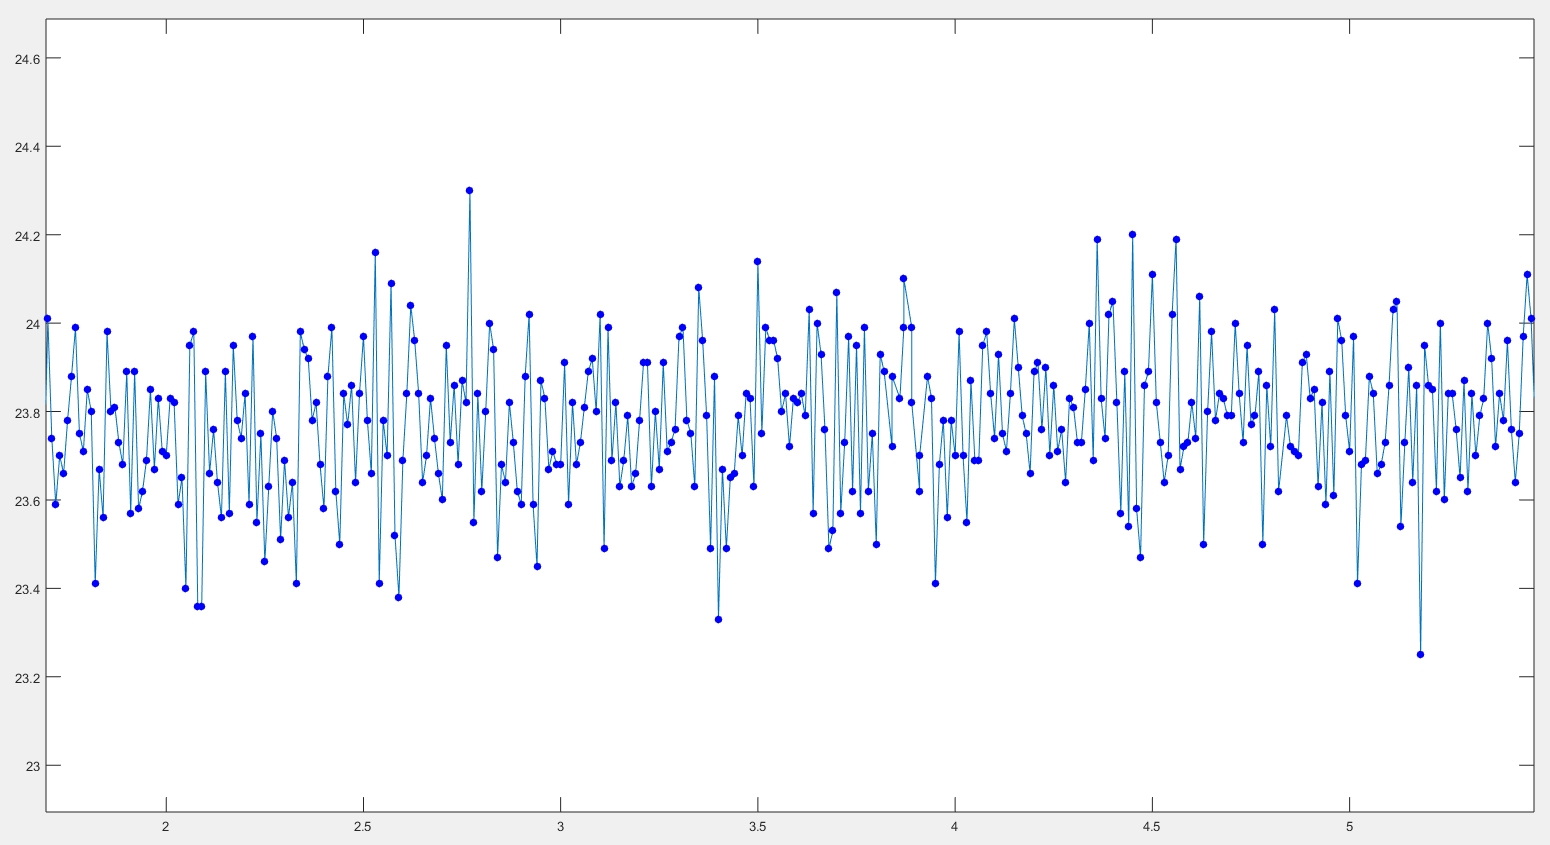
1. Wire K-Type thermocouple at room temperature:
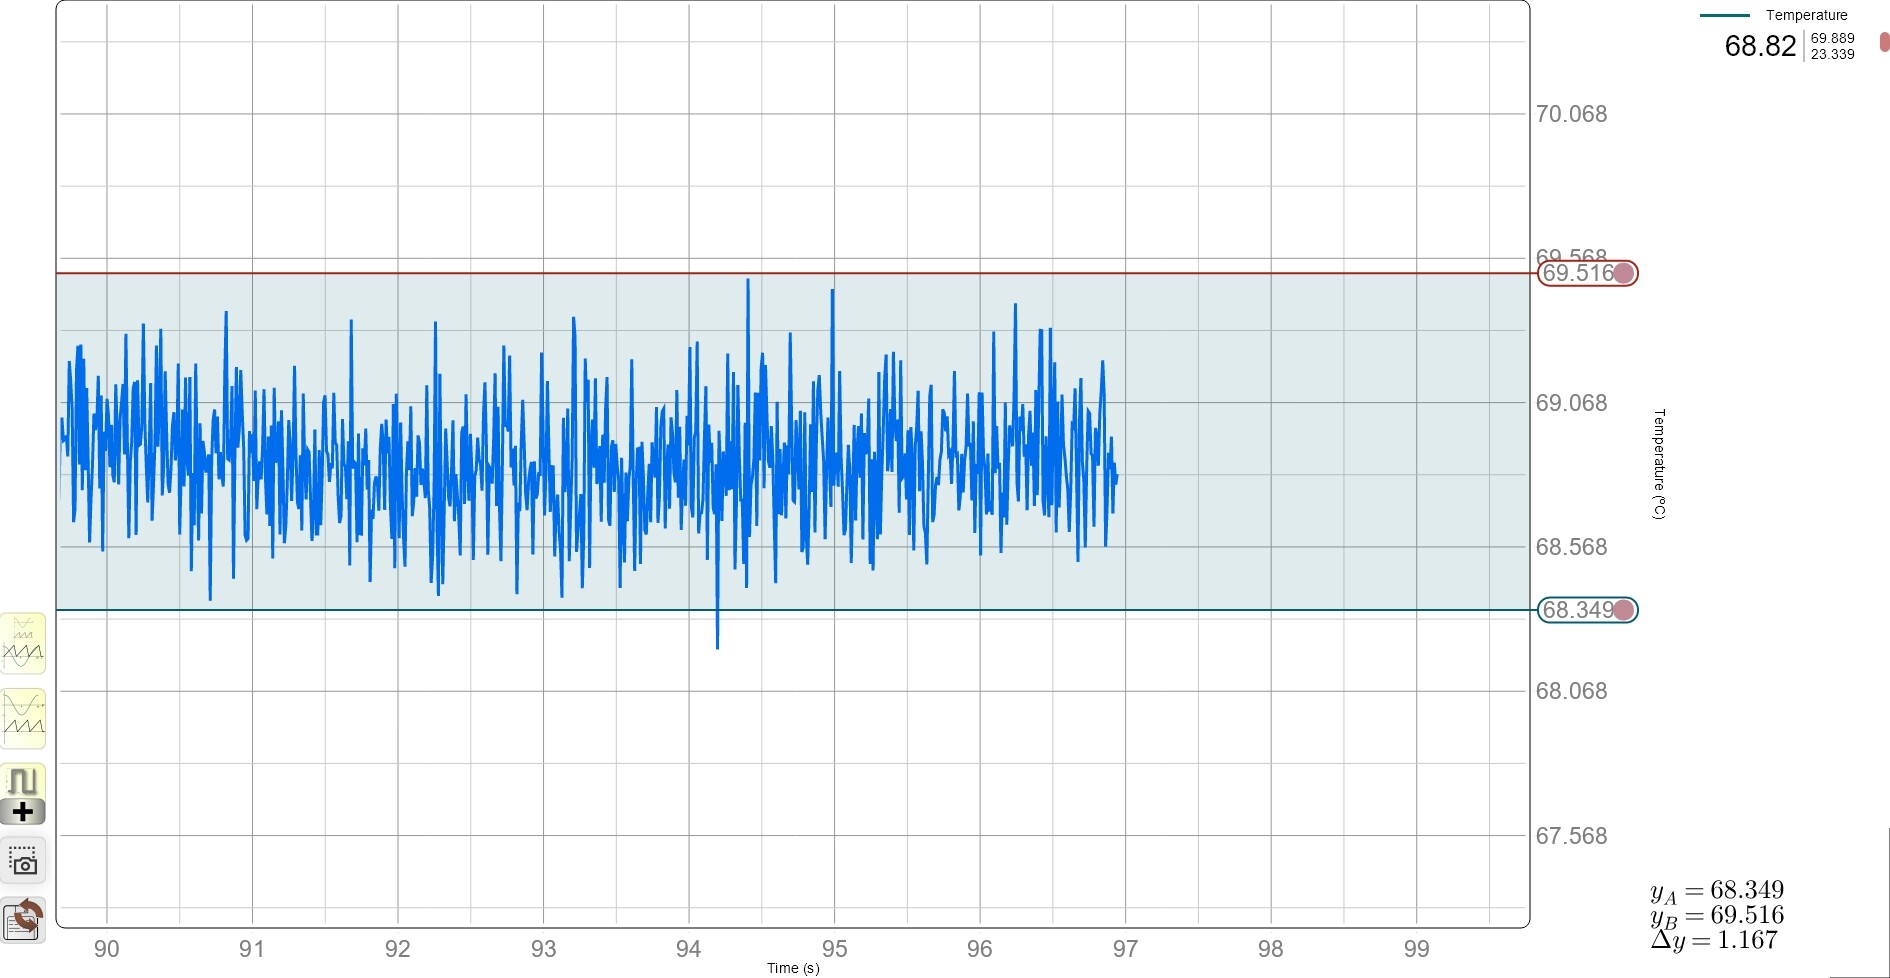
2. Wire K-Type thermocouple submerged in water cooling from boiling point:
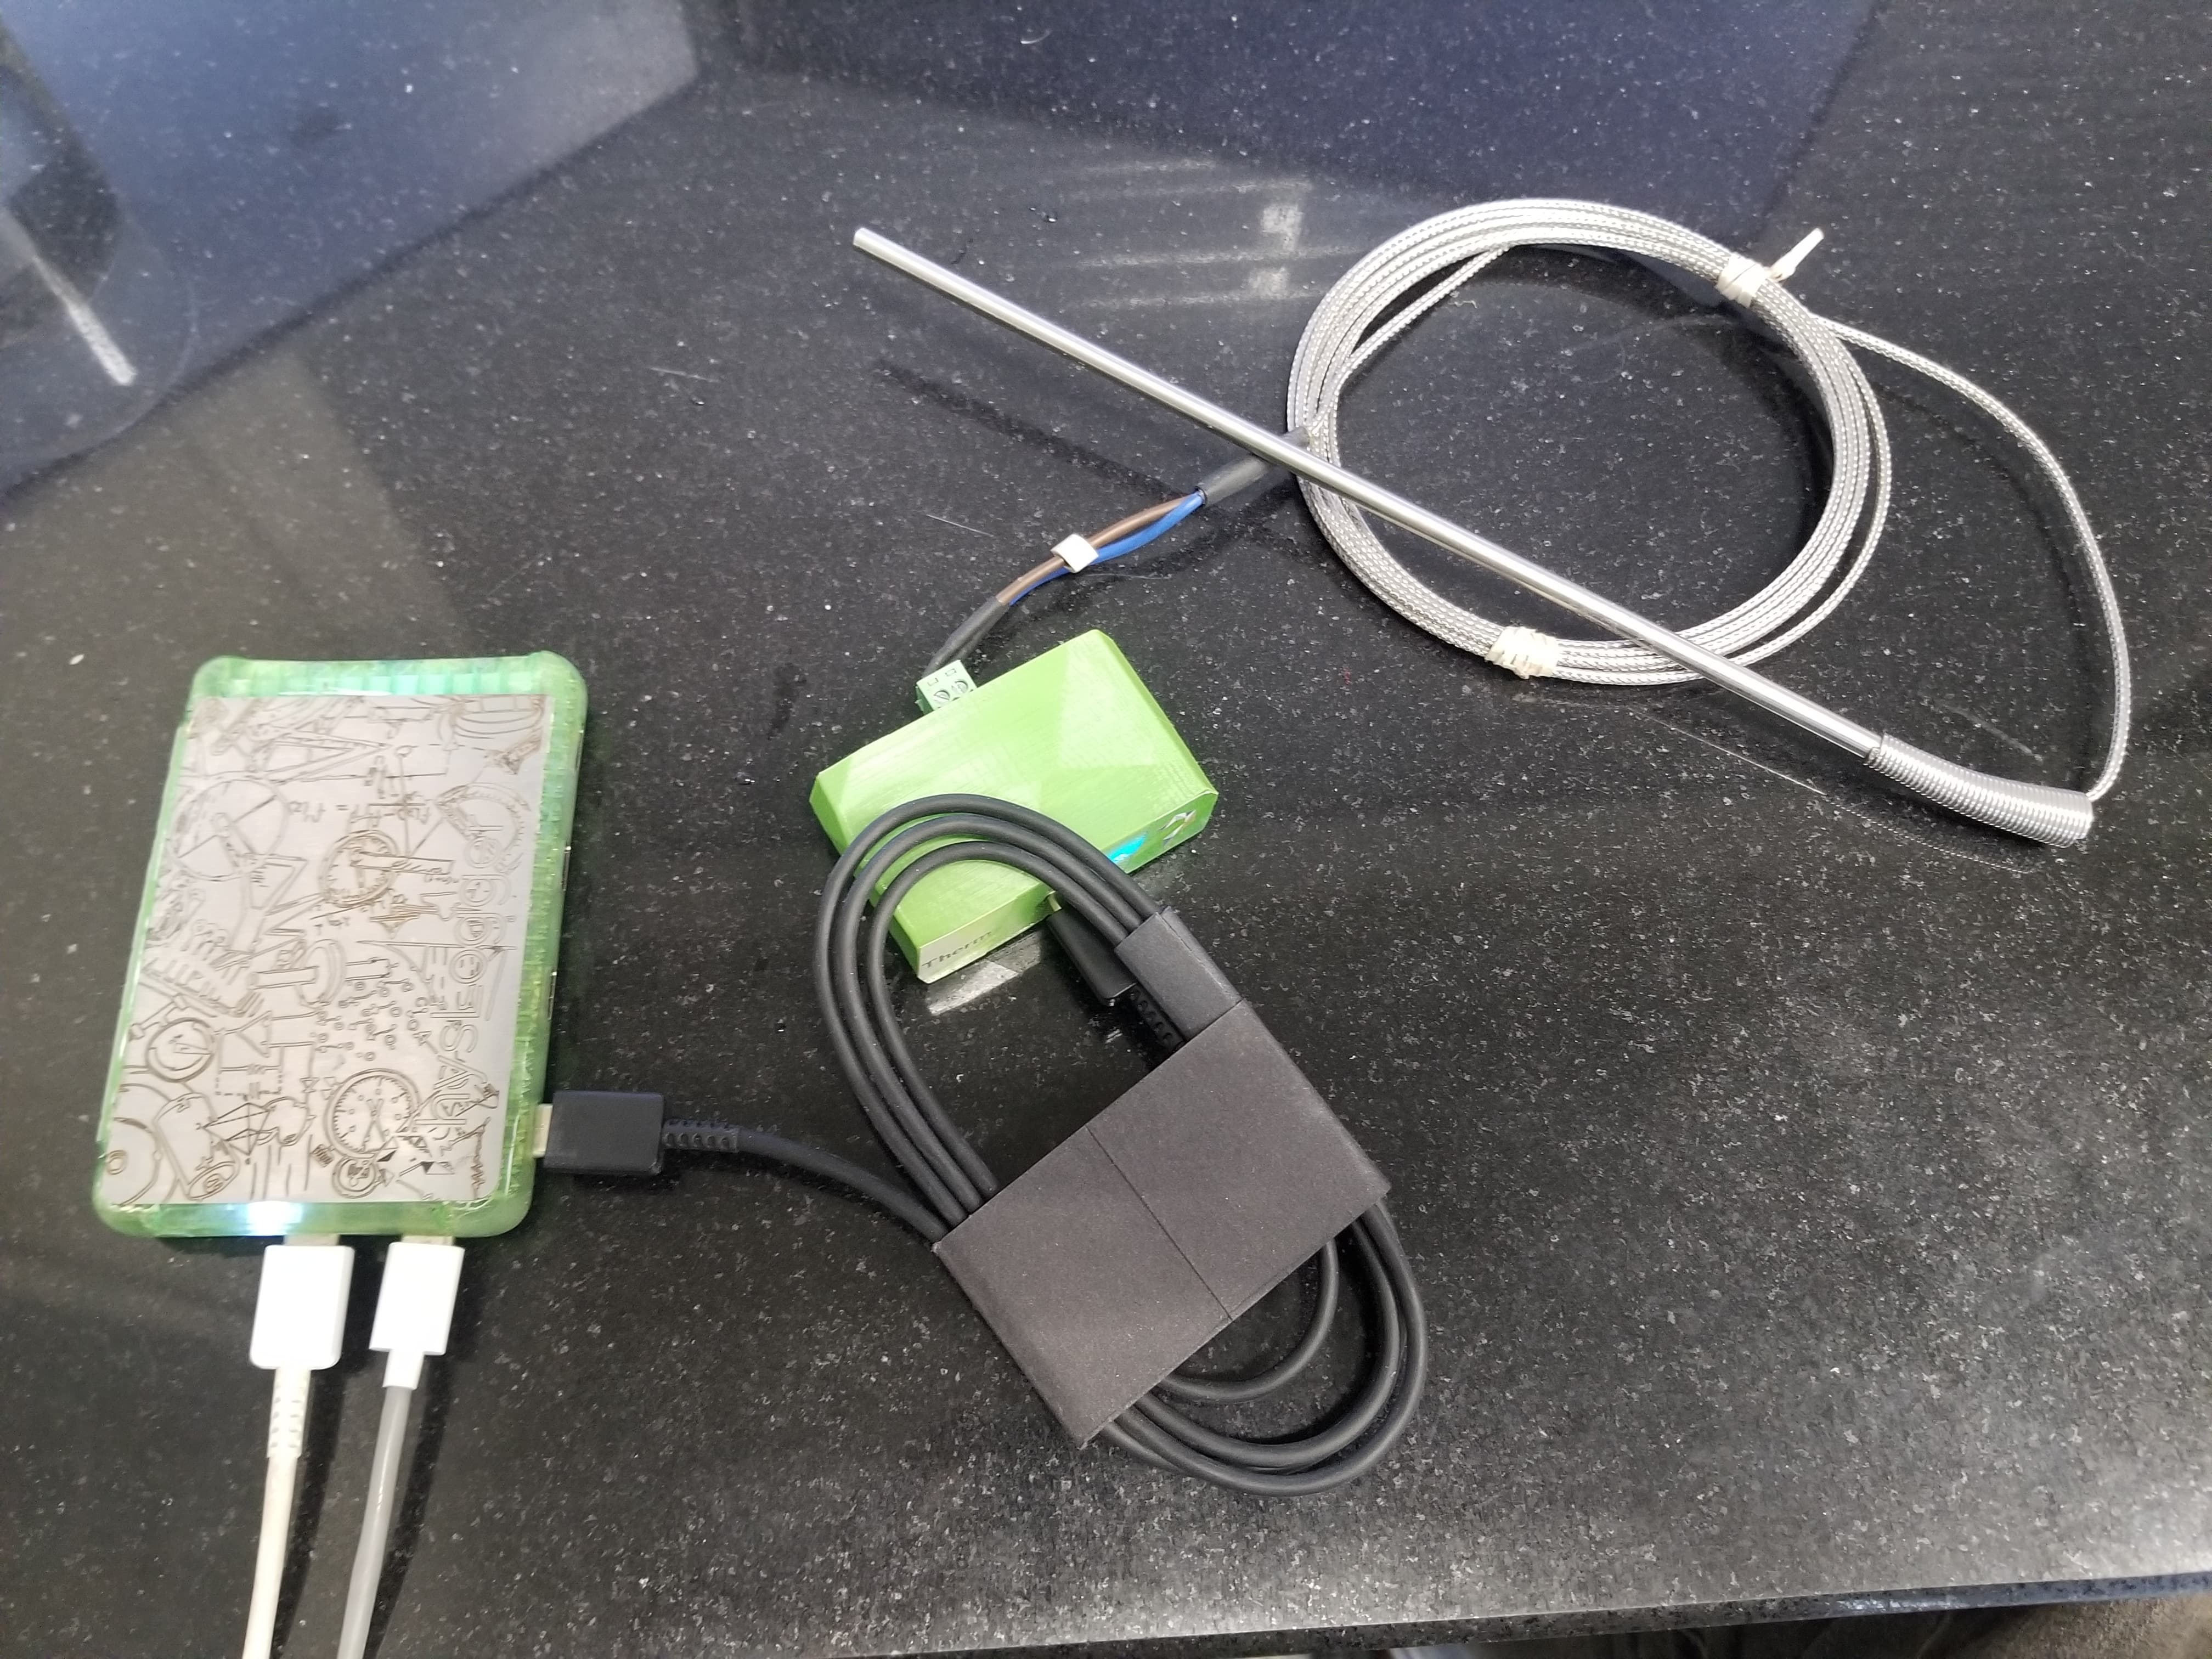
3. Rod K-Type thermocouple at room temperature:
4. Rod K-Type thermocouple, tip submerged in water cooling from boiling point: